Stuff - mainly geek, a little diabetes, some rant. Possibly all three in the same post. Basically anything I find interesting and/or worth sharing.
These are my personal views, unless I've been hacked.
I'm revisiting my KenKen project, it's time for a little performance tuning - my unit tests take about 14 seconds to run, which is too long. One of the immediate fixes I need to make is remove the arbitrary limit of 10 calculation iterations, and swap it with some logic to decide if another iteration is likely to be useful.
The logic runs something like this
10 if grid solved then quit
20 if iterations >= 10 then guess a square, reset iterations and goto 10
30 iterations++
40 start an iteration, calculating as many squares as possible
50 goto 10
After 10 iterations, the grid is unlikely to be solved using the rules I've created; what usually happens is that by iteration 4 there are no squares left that can be calculated using my rules, so iterations 5-10 are pointless. This is an example of some tracing that illustrates the point:
The logic I needed to implement goes more like this:
10 if grid solved then quit
20 if previous iteration resulted in no work then guess a square and goto 10
30 start an iteration, calculating as many squares as possible
UPDATE
You're possibly the only person reading this, so thanks. I implemented the changes outlined above and it's shaved 1-1.5 seconds off the tests, so I'm happy. New tracing looks like this:
I needed a component that will hook into any event raised on any objects, to keep track of the number of events raised. Simple, huh?
Hardwired Proof of Concept
My first attempt was in the constructor of the observed object, that registered its events to be handled by a CountEvent method in an EventMonitor object.
It worked:
But it seriously ignored SRP in that the observed object shouldn't care how its events are handled.
Refactor I - The EventHandler Parameter
With SRP in mind, I created a RegisterEvent method to accept the object's event, so that the monitor could add its own handler - there still needed to be knowledge of observer and observed, but that could be handled in a builder object so no harm there. A nice side effect of this is that the method that actually handled the event (CountEvent) could be made private. This is the EventMonitor code:
Lovely. Next, time to implement the new RegisterEvent in the client:
Easy. Now, time to run it:
Hmm. I'm not entirely sure what happened there, but it appears that you can't just go passing events around like that as it doesn't give you access to the Add and Remove handlers that you need to call (using the += and -= syntax). Note to self: Jon Skeet will know.
The ref Keyword is Your Friend
However, a quick addition of the ref keyword seemed to work:
The Builder
Excellent. Next, I wanted to totally remove the responsibility of event registration from the observed object. Enter, the builder object:
You'll notice that the event passed as the argument to RegisterEvent is in an error state. The error that this produced is "The event 'ObservedObject.ObservedEvent' can only appear on the left hand side of += or -= (except when used from within the type 'ObservedObject')"
What a shame. I can't access the event outside of the class itself except to add or remove a handler. I did want to use the add handler, honest, but just not inside the builder. Ok, that clearly wasn't going to work so I changed tack, and added the event handler directly from inside the builder.
It worked
What's That Smell?
Lets revisit the objective of the exercise: I need a component that will hook into any event raised on any objects, to keep track of the number of events raised.
Clearly I didn't have this yet - I'd merely abstracted the construction of one object into a builder class. All good, but a long, long way from any event on any object.
Reflection
As we know, nothing is really safe from prying eyes in the .Net world; every object is available to be decomposed via reflection. And if you can't beat them, join them... I found an article on MSDN, How to: Hook Up a Delegate Using Reflection. This explained how to use reflection to discover an object's events, and crucially how to create a delegate and use it to handle the object's events.
Here's the final code for the event monitor:
Here's an extended ObservedObject, with a standard and custom eventhandler:
And the builder. Note, this just passes the ObservedObject through to the EventMonitor, ensuring that if the ObservedObject changes by adding events, its builder doesn't need to.
GitHub
The final version of the EventMonitor example is available to inspect here on GitHub
95% of the time, when I create a class in Visual Studio, I create a corresponding test class. The class ends up looking something like this:
To get to this from a standard "new class", it's approximately 100 keystrokes. As there's a finite number of keystrokes you can make before you die (see Scott Hanselmans evidence), it's important to cut down the number of keys you press as it will eventually kill you - unless I've deliberately misread the angle of Mr Hanselman's blog post. Anyway, what I needed is a VS template that gives me the above code.
Create The Content
The first step to creating a template is to write the code that you want to end up with - for me, that's the code as shown above. I saved this in a file called NUnitTestFixture.cs.
Define The Template
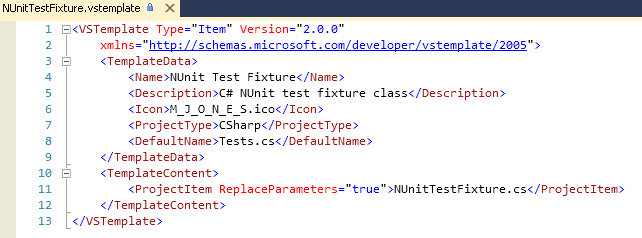
Next step is to create the mechanism for telling Visual Studio about your template. This is done via an XML definition of your template, saved as a file with a .vstemplate extension. This is the XML definition of the NUnitTestFixture template:
This is what the important parts of this file defines:
Lines 3 - 9 <TemplateData> defines how the item will appear in the VS "Add new item" dialog.
Lines 4 - 8 define the individual items of information, displayed in the dialog as shown:
Lines 10-12 <TemplateContent> define the items that will be added to the VS project when this item is selected.
Line 11 defines the single item of this template, the code template. I'll show later how to package the template so that these files are available to Visual Studio. The TemplateContent element defines a file that makes up part of the template - in this example there's just one element for the code file NUnitTestFixture.cs. If there was e.g. a help file, a resource file, a designer etc, these would each have a separate TemplateContent element. In the element in the example, the ReplaceParameters attribute indicates that placeholders in the file can be replaced with variables.
Replace Parameters
When a NUnitTestFixture class is required in a project, there will be details that are only known when the item is created, for example the default namespace of the project, and the name of the class as input by the user:
Templates are able to be parameterised so that at the time of creation, placeholders can be replaced with their correct values. There are several built-in parameters available to use, see the MSDN documentation for a full list.
For the variables shown above, the built in parameters that are needed are rootnamespace and itemname; rootnamespace is the default namespace for the project the item is being added to, and itemname is the name of the file as input by the user on the "Add new item" dialog. The convention for defining placeholders is to wrap the parameter name in $ characters, so NUnitTestFixture.cs needs to look like this
Package The Template
For Visual Studio to make the template available, it needs to have all the files supplied in the form of a ZIP archive. For the example here, the files to include are
the code file, NUnitTestFixture.cs
the 48x48 pixel icon file, M_J_O_N_E_S.ico
the template definition file, NUnitTestFixture.vstemplate
Put these files in the same folder, and add them to a ZIP file - the easiest way is to select the files, right click and choose Send To -> Compressed (zipped) Folder. The resulting ZIP file needs to be copied to Visual Studio's Item Templates folder, and will then be available on the "Add new item" list.
Tip: to find out where your Item Tempate folder is, go to Tools -> Options -> Projects and Solutions -> General.
Further possibilities
I've barely scratched the surface with this template and there is far more configuration available than this blog post shows. There's a heap more to read about this topic on MSDN.
I recently created a local Git repository (see Steve Fenton's step-by-step guide) for a hobby project - it needs some rehactoring (sic) so I want a reliable fallback position. After I'd committed the source files I wanted to track, I was left with a lot of chaff:
I tried all the obvious tricks, in the obvious order: select the files, hit delete; select the files, right click, hunt for "exclude"; check each menu item; Google it; search StackOverflow; search the GitHub help. Nothing that said "This is how you exclude chaff files". So...
This is how you exclude chaff files
Create a file called ".gitignore" in your repository directory. This is incredibly easy in Windows, despite the "extension only" Unix style: Open Notepad, click Save As, navigate to your repository directory (not in the .git directory, but at the same level) and save the file as ".gitignore".
Edit the file to include the names or patterns of the files or directories you want Git to ignore. As an example, I used this list
Rescan the repository in the GitGui - this should now look much cleaner
Add .gitignore to the repository; stage, sign-off, commit etc
Following on from yesterday's blogpost about Visual Studio external tool output, I've written a tool that will be useful to me and hopefully others. A common directory structure when using binary dependencies in your VS projects is something like this
Projects\Dependencies
Projects\KenKen\SourceCode
Projects\FizzBuzz\SourceCode
When I'm in a project that has references to libraries in the Dependencies folder, I occasionally need to check the version of the libraries I've referenced. My tool, FileVersion, takes two parameters, a start directory and a search directory, and walks up the start directory one level at a time until it finds the search directory. It then reports on the versions of the libraries (.dll and .exe) in that directory.
If the tool is called as an external tool in Visual Studio, it can be configured to search for the dependencies for the current project.
The output from running the tool looks like this in VS, saving you traversing the directory structure yourself and viewing each file's properties manually
The Problem
Imagine the scene; you've created a class library with a test project. There's an internal method you need to test (yes, you are aware of SRP, you have considered it and you have made a conscious decision to use an internal method), but because you've decorated the assembly with the InternalsVisibleTo attribute:
everything builds and runs.
Then your pairing buddy suggests you sign your class library with a strong name. You consider this suggestion and agree it's a brilliant idea, so you do it. You sign both projects with the same key:
You build the project and:
At this point you know you have to extract the public key from your executable and add it to the constructor of the attribute. You know the public key is over 300 characters and you're unlikely to be able to guess it. You remember that it's sn.exe you need to run to do extract the key, but struggle to remember the parameters or even, if you're honest, the location of the exe.
The Solution
Use the External Tools facility within Visual Studio. This allows you to specify a command line to run, with optional parameters that can contain certain Visual Studio values such as the solution path, the project path or, more interestingly for us, the path to the compiled executable for the project.
Under the Tools menu, click on External Tools... This opens a dialog that allows you to specify your external tool:
From the top, the inputs are:
Title. What's displayed in the Tools menu. Note the & character before the P; this is a throwback to the early 90s when you navigated Windows 3.1 with a keyboard. It allocates a hotkey to the menu item when you press the Alt key
Command. The path and file name of the executable (sn.exe in this example).
Arguments. The command line arguments to pass to the command.
Initial Directory. The directory to run the executable in.
Use Output Window. The "wow factor" point of this post. This redirects the output to the Visual Studio output window, so the public key can be easily copied and pasted into the attribute's constructor.
When this external tool is run, assuming you have the correct project selected, now produces this in the VS output window:
A job for another day is to write a simple app to wrap sn.exe and copy the public key above, minus its spaces, into the clipboard to make life even easier. Keep an eye on GitHub for some code, possibly coming soon.
This post will show how to create a debugger visualiser for visual studio, and use it to display and update a debugged object's data. It is a step-by-step guide, and the resulting code (written in C#) can be found on GitHub. I recommend getting this code to get a feel for how to produce a visualiser.
The object that we're going to visualise has two properties: Colour and IntArray.
public class DemoObject
{
 static Random _random = new Random();

 public DemoObject()
 {
  Colour = Color.DarkOrange;
  //Build a large array that isn't easy to see in the debugger
  IntArray = InitialiseRandomArray(18, 7);
 }

 public int[,] IntArray { get; private set; }
 public Color Colour { get; set; }

 private static int[,] InitialiseRandomArray(int index1, int index2)
 {
  var intArray = new int[index1, index2];

  foreach (var i in Enumerable.Range(0, index1))
  {
   foreach (var j in Enumerable.Range(0, index2))
   {
    intArray[i, j] = _random.Next(0, 255);
   }
  }

  return intArray;
 }
}
As you can see, this is not easily viewed in the debugger:
Our object's IntArray property is a two dimensional array, which we're going to display in a table; Colour will be displayed as the background colour of a picture box.
A debugger visualiser can be a windows control or form; for this demo we'll be using a form. So, create the form, give it a name of "DemoObjectVisualiserForm". Add a textbox - make it multiline, change its name to "arrayContents" - this will be used to display the tabulated contents of the 2 dimensional array. Add a picturebox, call it "colourBox" - this will show the object's colour, rather than the description of the colour shown in the debugger.
As this form is to display an object of type DemoObject, create a constructor that takes an instance of DemoObject as its argument; store this object in a private member variable "_objectToVisualise".
To expose the visualiser API, add a reference to Microsoft.VisualStudio.DebuggerVisualizers:
Add a public class DemoObjectVisualiser, inheriting from DialogDebuggerVisualizer. Implement its Show method:
public class DemoObjectVisualiser : DialogDebuggerVisualizer
{
 protected override void Show(IDialogVisualizerService windowService, IVisualizerObjectProvider objectProvider)
 {
  //make sure the object is the correct type
  var objectToVisualise = objectProvider.GetObject() as DemoObject;

  //Show the visualiser
  var form = new DemoObjectVisualiserForm(objectToVisualise);
  windowService.ShowDialog(form);
 }
}
Show is the method that's called by the Visual Studio debugger, and takes 2 arguments: IDialogVisualizerService and IVisualizerObjectProvider. IDialogVisualizerService allows the visualiser to be displayed on the UI, and IVisualizerObjectProvider wraps the object to be visualised.
As the object is serialised to be passed between Visual Studio and the DialogDebuggerVisualizer, DemoObject must be decorated with the Serializable attribute unless you plan to implement manual serialisation and use a VisualizerObjectSource.
    [Serializable]
    public class DemoObject
In order to test your visualiser, you can use an instance of the VisualizerDevelopmentHost - this is a proxy of the Visual Studio debugger and is a quick and easy way to fire up your debugger visualiser without running your client code.
This example is a console application, with a reference to Microsoft.VisualStudio.DebuggerVisualizers
using Microsoft.VisualStudio.DebuggerVisualizers;
using VisualiserDemo;

namespace DevelopmentHostDemo
{
    class Program
    {
        static void Main(string[] args)
        {
            var objectToVisualise = new DemoObject();
            var host = new VisualizerDevelopmentHost(objectToVisualise, typeof(DemoObjectVisualiser));
            host.ShowVisualizer();
        }
    }
}
So that the debugger knows to give the option of visualising an object using our new visualiser, the object to visualise needs to be decorated with the DebuggerVisualiser attribute:
    [DebuggerVisualizer(typeof(DemoObjectVisualiser), Description="Jonesy's amazing visualiser")]
    [Serializable]
    public class DemoObject
The DemoObject is now able to be visualised in the DemoObjectVisualiserForm; run the client code and break when the DemoObject instance has been created. When you view the instance in the debugger, you'll see a small magnifying glass icon:
Click this, and your object is displayed in the form:
As well as being visualised, the object can be updated via the form. To demonstrate this, add a button to the form and in its Click event handler, hide the form.
Set the Modifiers property of the picture box to Public; this is a rough hack to enable it to be visible outside of the form. Add a Click event handler to the picture box, and add the following code to update the colour:
private void colourBox_Click(object sender, EventArgs e)
{
 //When the colour is clicked, show the dialog to change it
 var colordialog = new ColorDialog();
 var result = colordialog.ShowDialog();
 if (result == System.Windows.Forms.DialogResult.OK)
 {
  colourBox.BackColor = colordialog.Color;
 }
}
The last step to get the colour change reflected in the debugger is to update the object. Add the last few lines here to the Show method in the DemoObjectVisualiser object:
public class DemoObjectVisualiser : DialogDebuggerVisualizer
{
 protected override void Show(IDialogVisualizerService windowService, IVisualizerObjectProvider objectProvider)
 {
  //make sure the object is the correct type
  var objectToVisualise = objectProvider.GetObject() as DemoObject;

  //Show the visualiser
  var form = new DemoObjectVisualiserForm(objectToVisualise);
  windowService.ShowDialog(form);

  //If the object is replaceable, update the colour
  if (objectProvider.IsObjectReplaceable)
  {
   objectToVisualise.Colour = form.colourBox.BackColor;
   objectProvider.ReplaceObject(objectToVisualise);
  }
 }
}
This will update the debugged object with the new colour, when the save button is clicked: